Week 2: Data Storage & Visualisation

IoT is a three pillared system made from:
- Data Acquisition,
- Data Storage
- Data Visualisation.
From looking at hardware and sensors making up our Data Acquisition component of our three pillared IoT system we now look toward Data Storage & Visualisation of storred data.
Our Studio broke into groups to research database storage and visualisation. Our group discussed what we needed to do to achieve this and individually looked up database interfacing:
I found a lot of URLs below are the notable URL’s found and main notes from the pages:
stackoverflow.com
stackoverflow.com
- Link through to web-page here
- Database Selection – “SQLite doesn’t support network access so don’t go for that!”
-
- Database Hosting – There are many hosts online to choose from. Cloud providers are scalable and easy to deploy. Providers include AWS/GCP/Azure. If you were to go this option, choose which one you’re familiar with.
-
- Python Integration – Loads of python packages for interfacing with database via standard query language. For MySQL have mysql connector.
digitalocean.com
digitalocean.com
- Link through to webpage here
- 3 main database management systems – SQLite, MySQL and PostgreSQL.
- SQLite
- Self contained and fully open source,
- Known for portability, reliability and strong performance in low-memory environments
- It’s serverless so you write to the database directly instead of going through a server.
- Advantages: Small footprint, User friendly & Portable
hackaday.com
hackaday.com
My Colleague Tim Baker (click here for Tim Backer) shared this page for something for us to look into later as a more complete database and visualisation avenue.
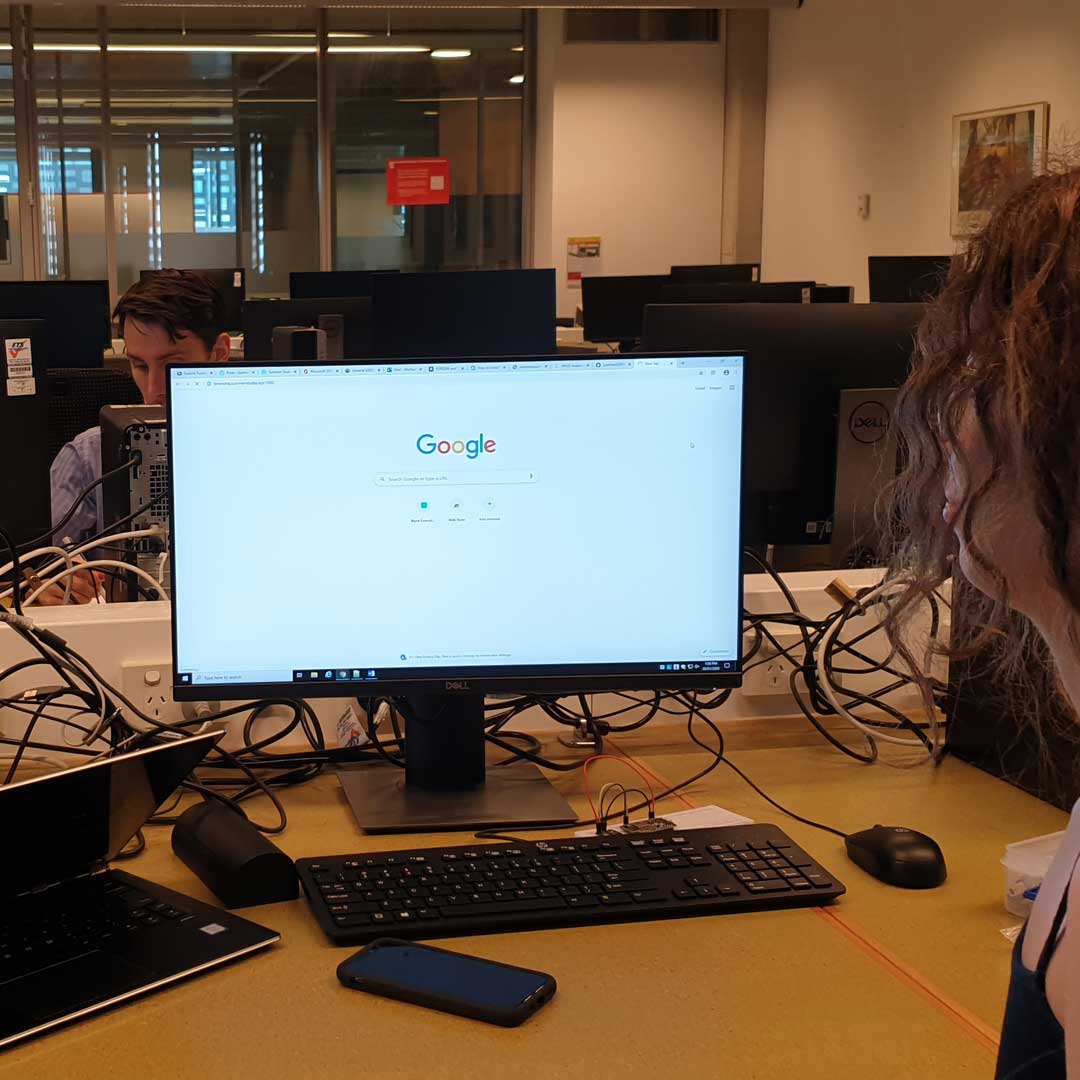
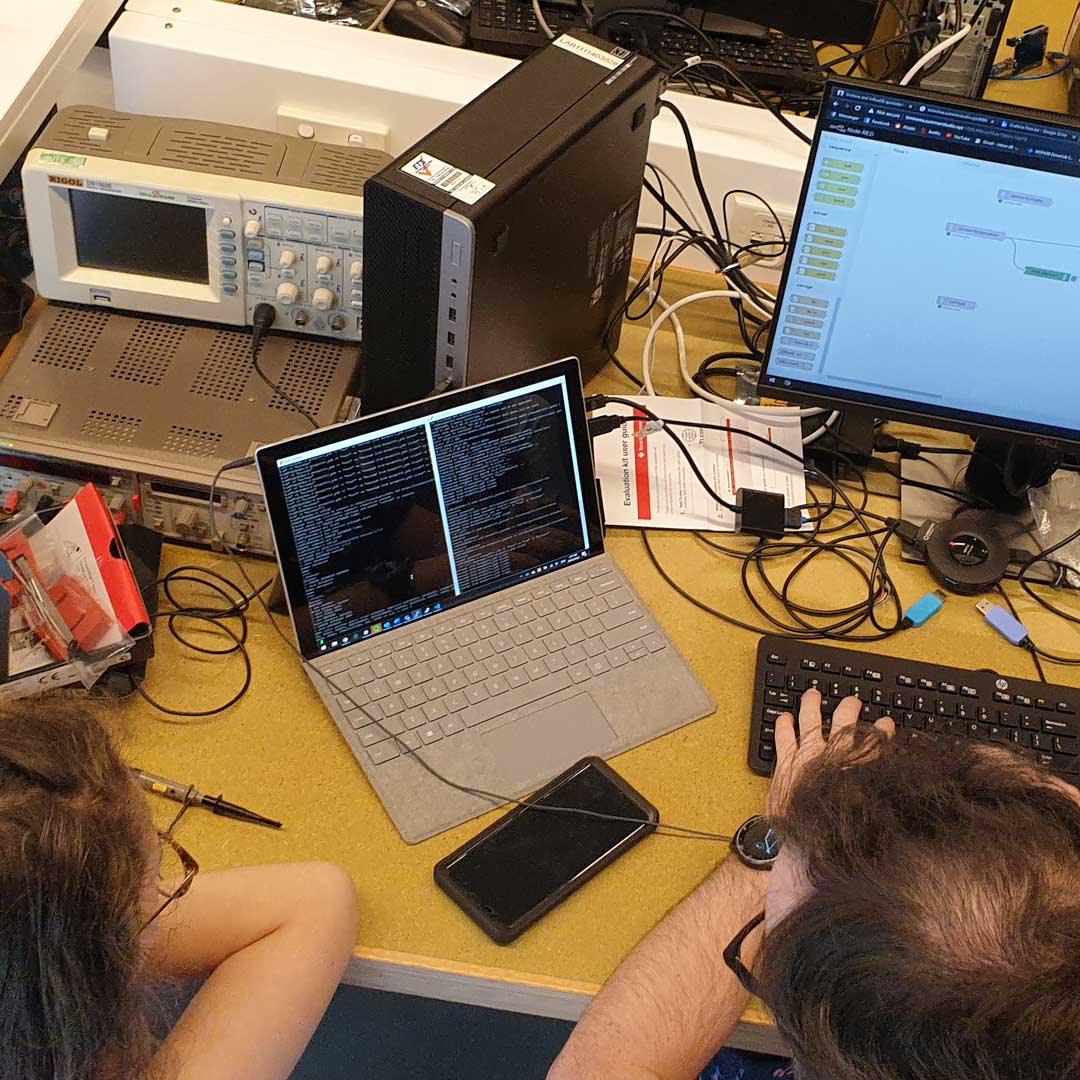
Malan Christiansen had found this handy tutorial we could apply to configure out example of Data Acquisition, Data Storage & Data Visualisation. Insead of using an actual raspberryPi we used a public cloud storage to host a virtual cloud server, affectionatly reffered to as our "Pi in the sky". This server is hosted on Voltr with all group members having access to the server. ![]()
We set up our server using Ubuntu, as we know Ubuntu well. Setting up the server cost us $5.00 per month (the lowest amount). We chose this as we can always scale up the server (costing more) to match our needs but can not scale down. To access the server we used PuTTY on our personal laptops. We can also access the server by logging into Vultr with out personal credentials and using the virtual console.
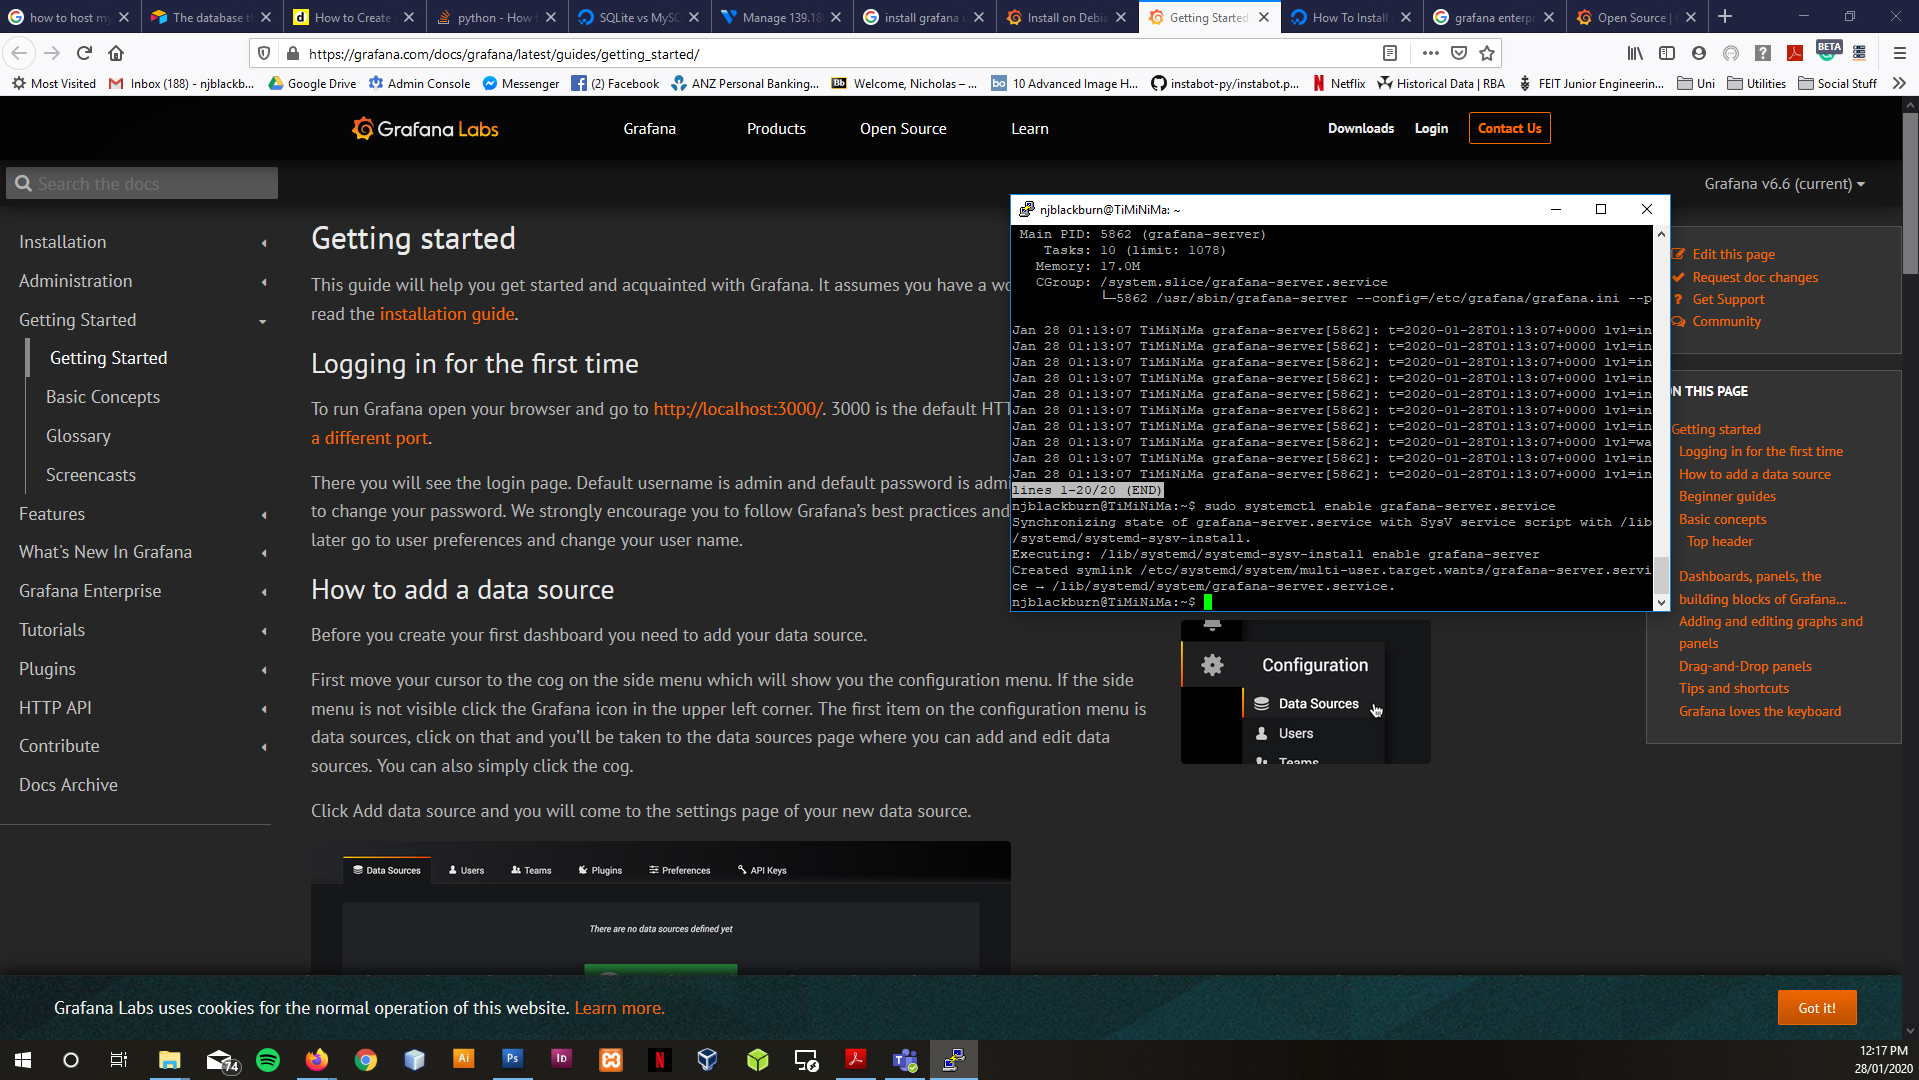
We split the task of installing all the useful applications (Grafana, mosquitto, InfluxDB & NodeRed) between each member in the group. I was tasked with installing Grafana. Using Putty I installed, ran Grafana configured users and applicatoion execution on startup. I followed the tutorials and guidelines from the following URLs:
- https://grafana.com/docs/grafana/latest/installation/debian/
- https://grafana.com/docs/grafana/latest/guides/getting_started/
- https://grafana.com/docs/grafana/latest/installation/configuration/
Grafana SSH Install
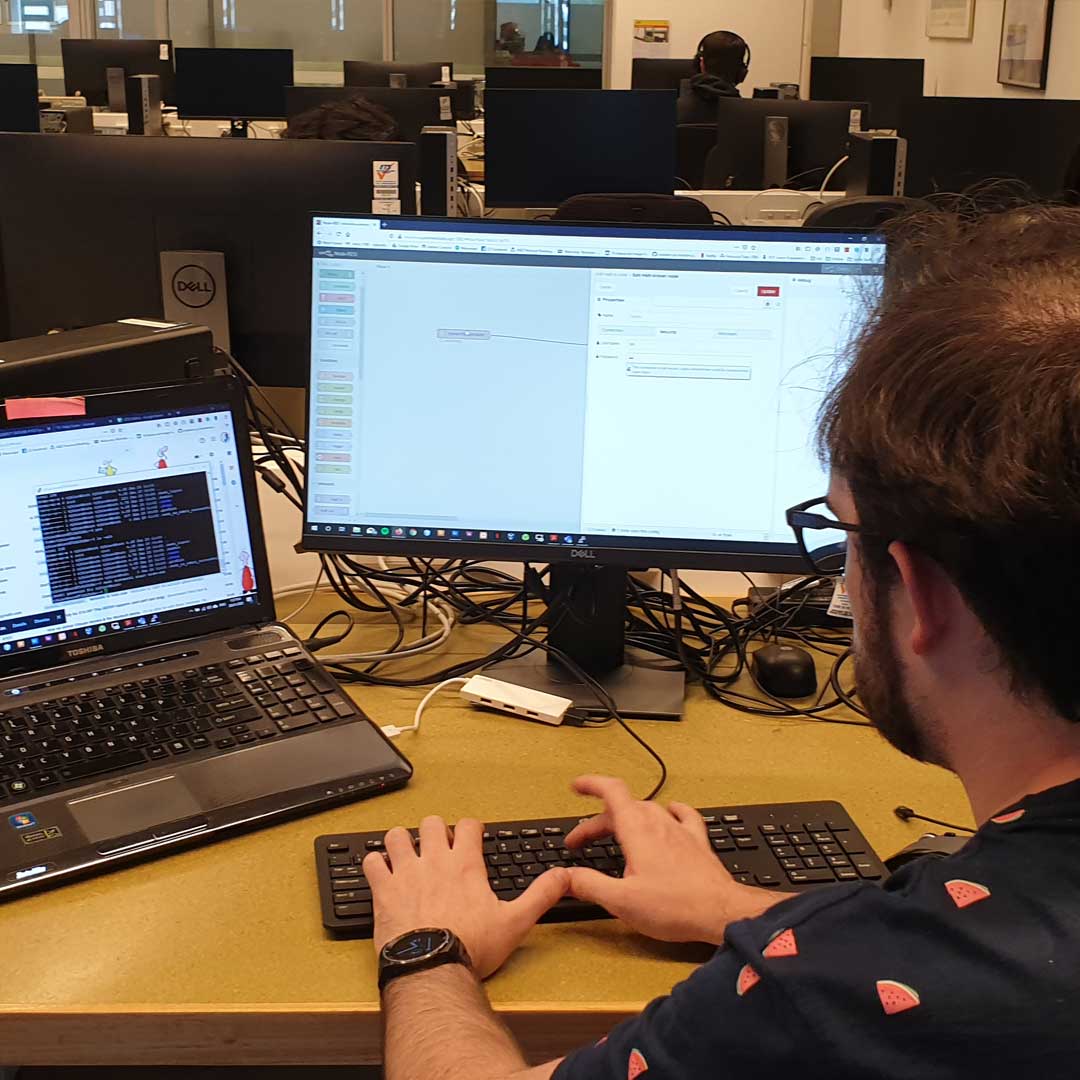
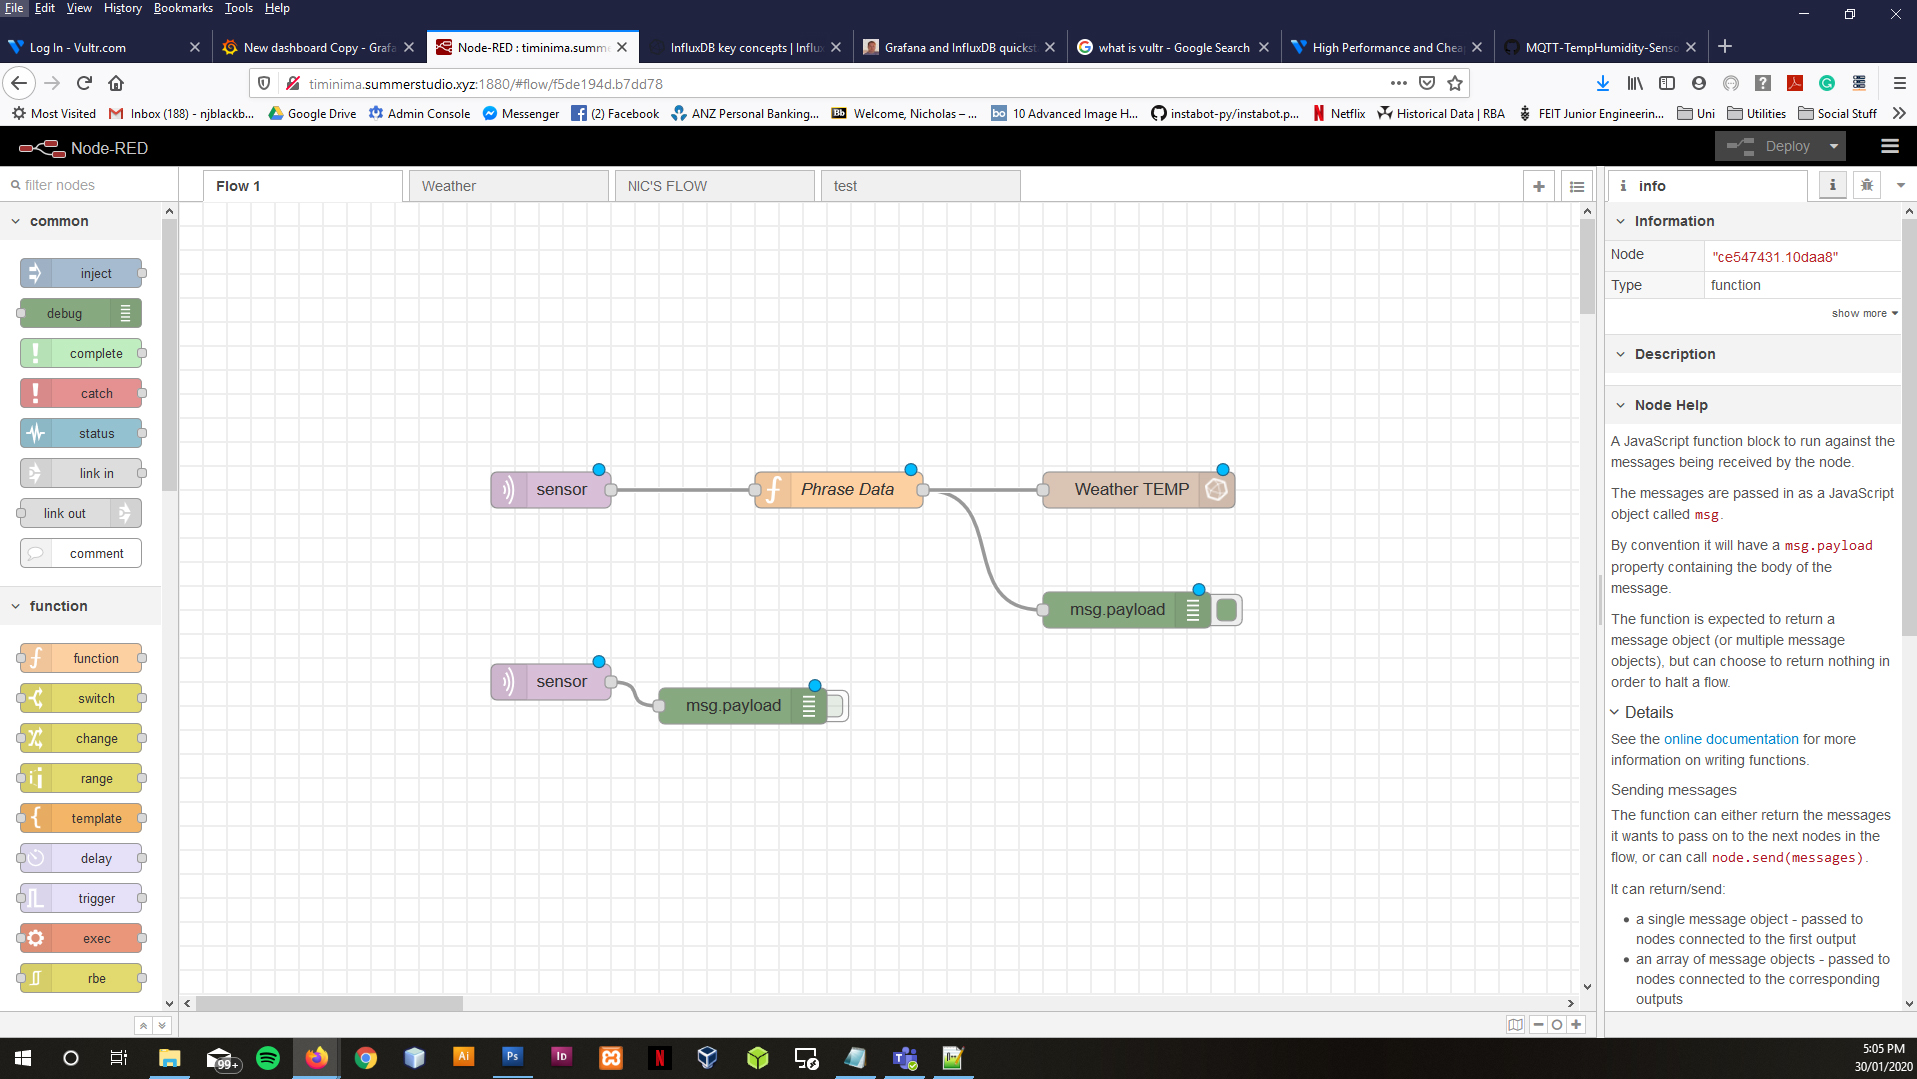
Node Red Initial Flow
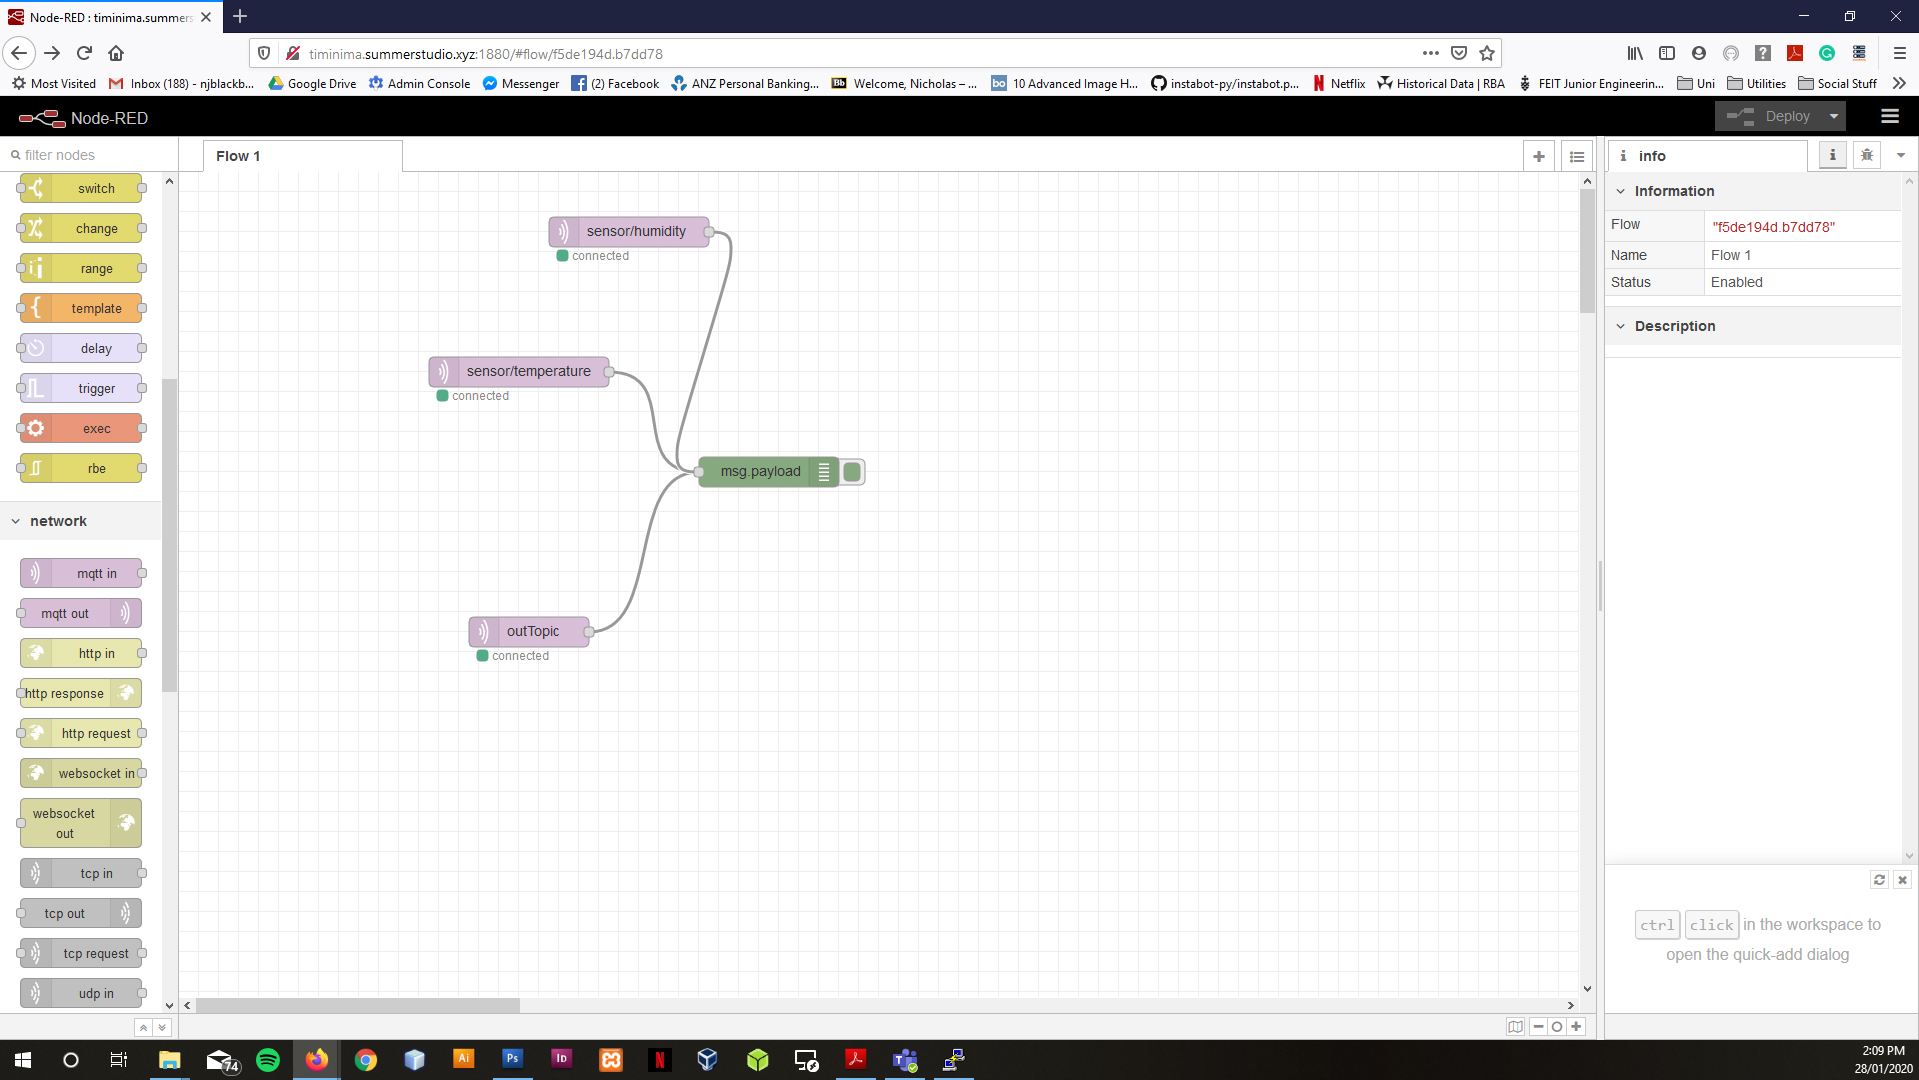
Once installed team members could log into NodeRed on the server through their web browser on their personal computer. Log in credentials were created for all team members. Through node read we can connect our MQTT broker & our database.
Follow the link below for the online tutorial we used to install NodeRed:
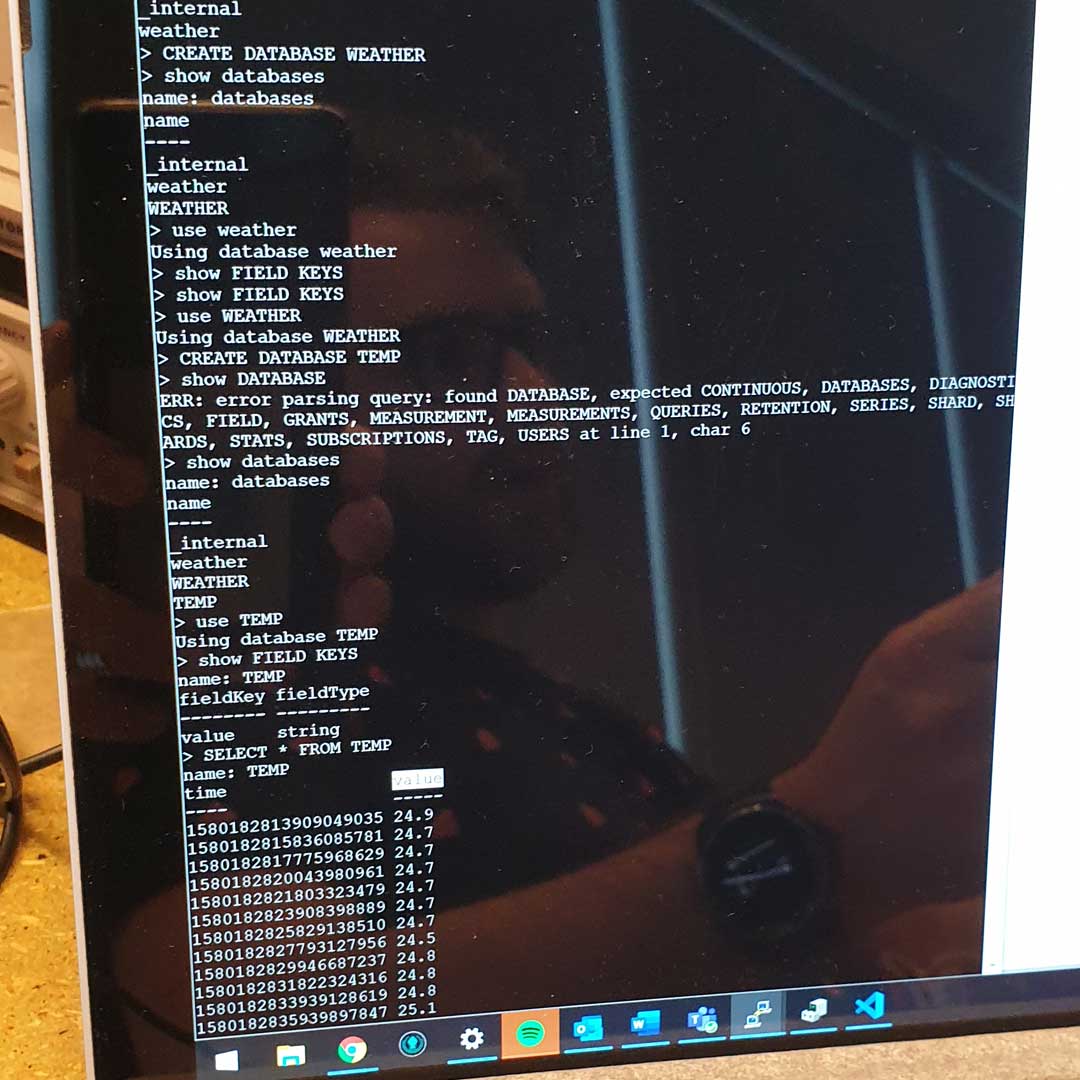
Installation of InfluxDB was found here.
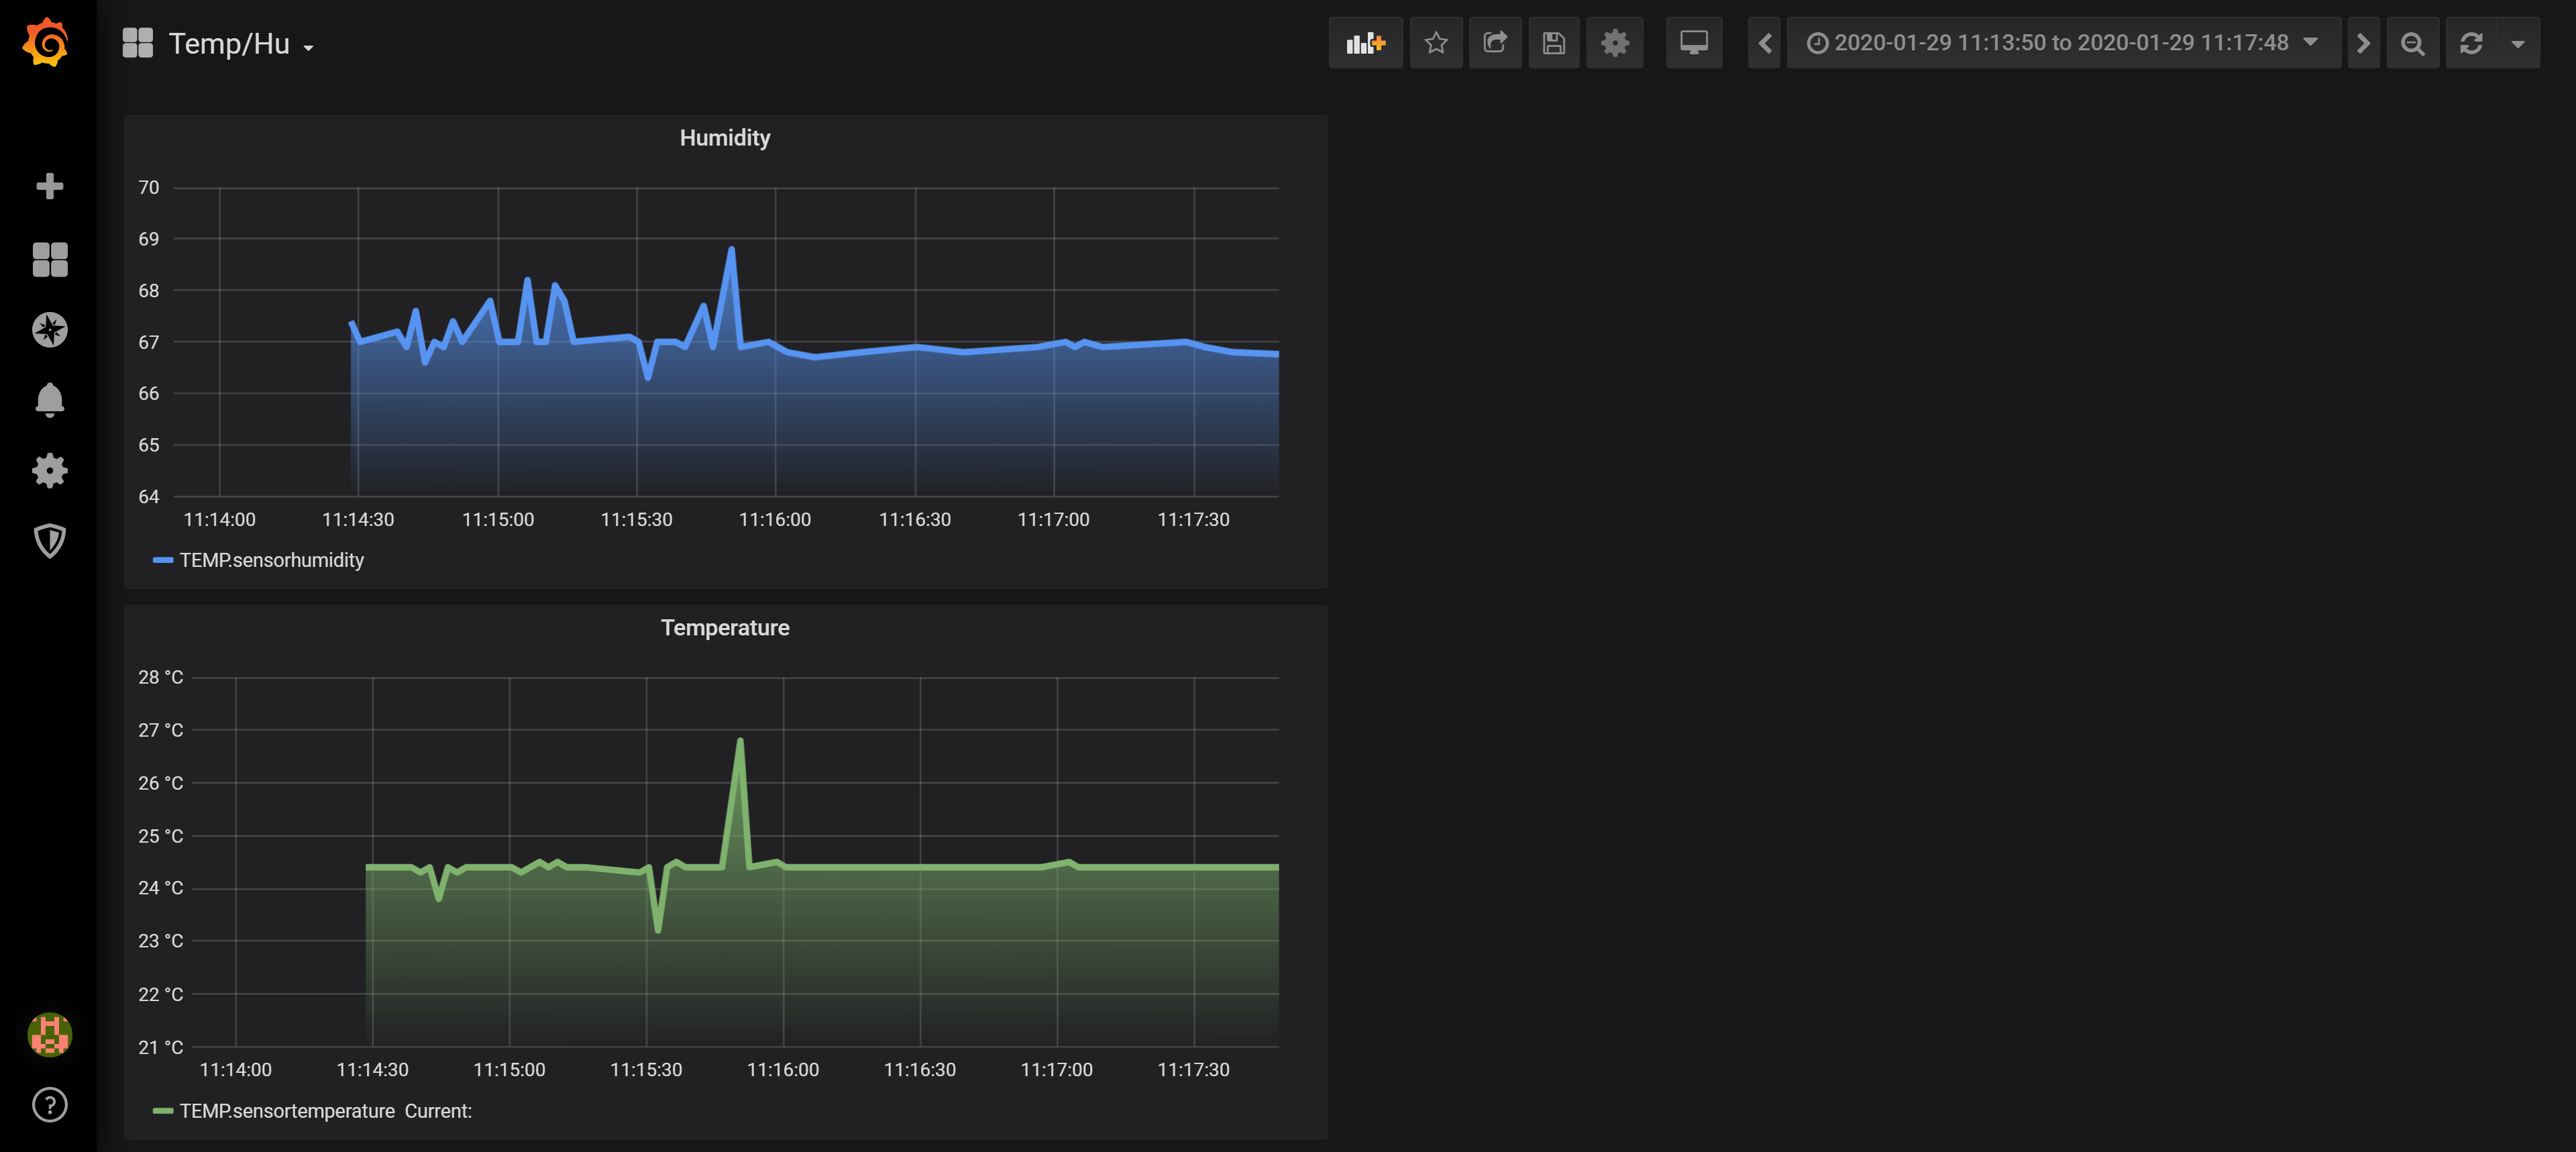
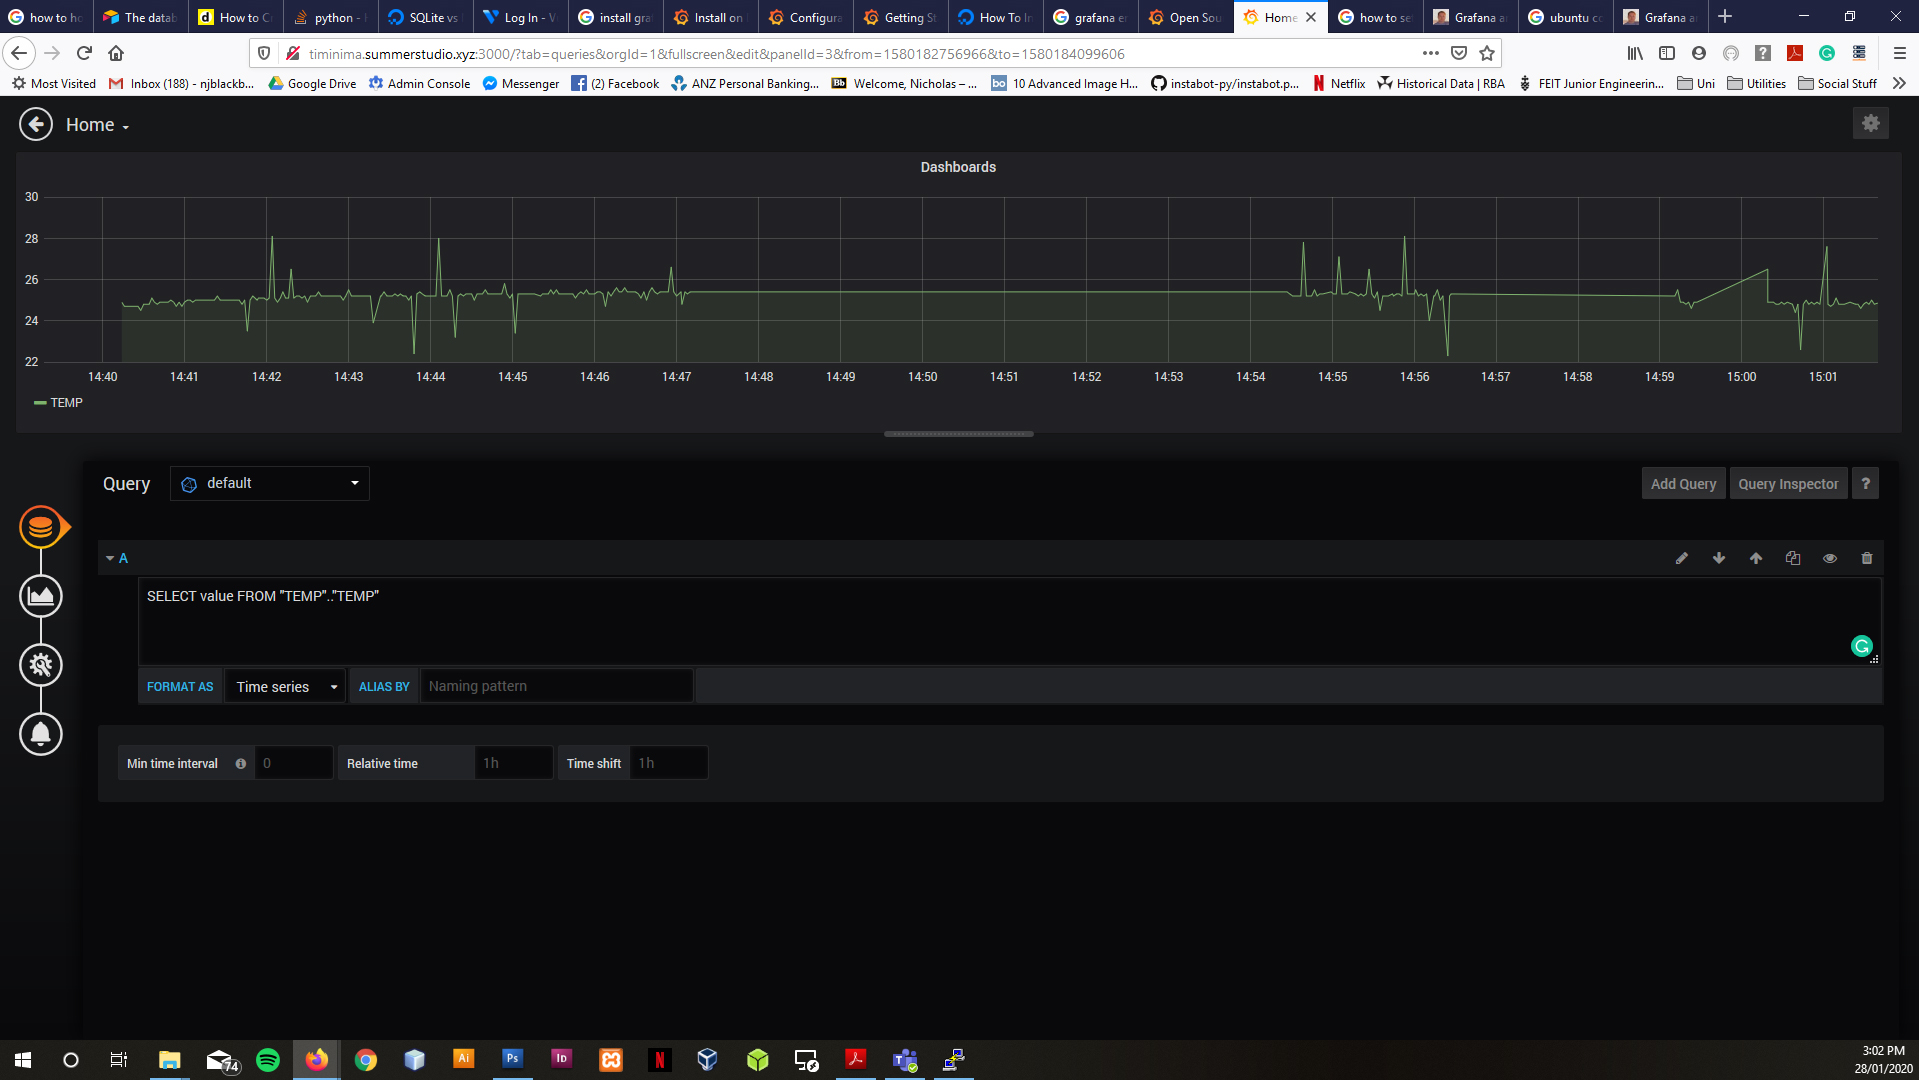
Once we had data "flowing" into out database we could pull that data from InfluxDB into Grafana for display.
Our data essential follows the path:
Sensor Device --> mosquitto MQTT Broker --> NodeRed --> InfluxDB --> Grafana
Node Red Initial Flow
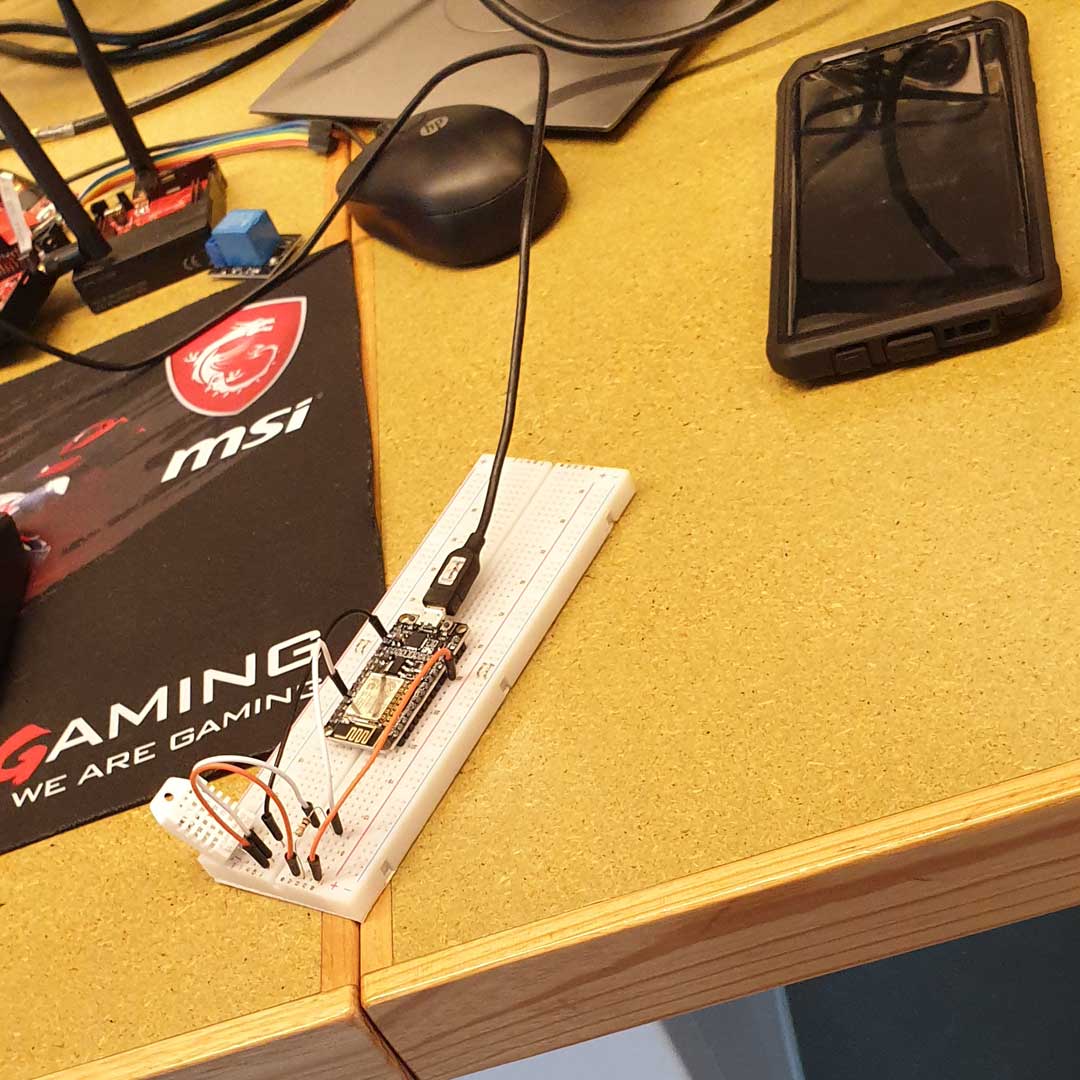
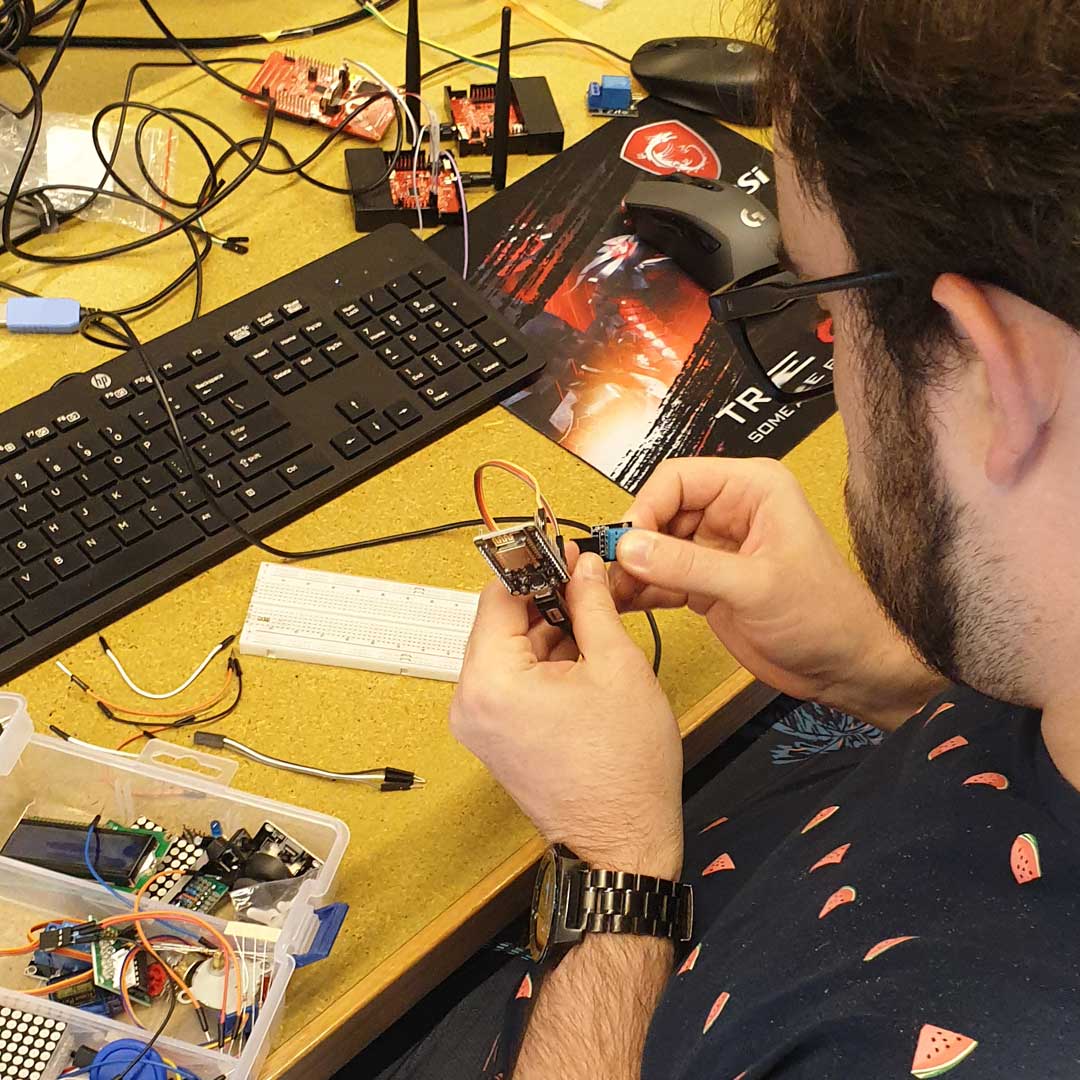
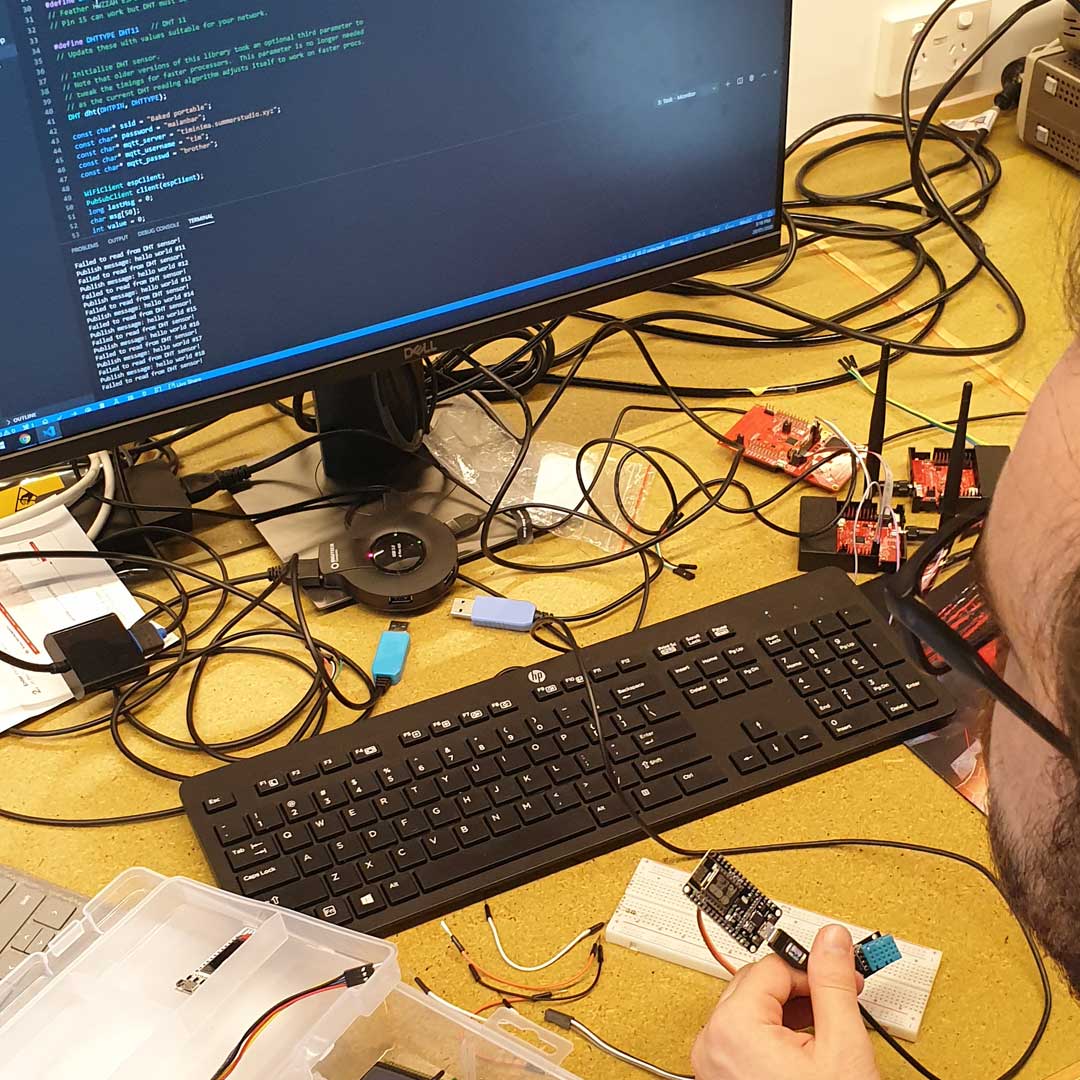
We had difficulties possibly with putting sensor data is the current pin is used for and LED and too fast for the sensor to operate. We changed the pin from D4 or D2 to D12 and seems to work correctly. We managed to fix our hardware errors and concentrate on our storage issues as we had difficulty in gettng our data into InfluxDB in the correct collumns. As with every good project there is a little research, trial, error, research, debug & trial again.We gained a better idea of how we can tackle the problem tomrrow!
The source code for our acquisition device to acquire data for temperature and humidity is located onb GitHub in our group member Tim Baker’s repository:
We started the day with some networking issues which evolved into issues with out MQTT broker, mosquitto. As the UTS network blocks certain ports we connected to a private network and changed the port connection to from 1883 to 5269. This fixed our issue with mosquitto but we then needed to secure our connection by adding authorisation for our acquisition device to connect to mosquitto.
Once we had mosquitto back up and running we decided we would resolve our issues with NodeRed.
const char* ssid = secret_ssid;
const char* password = secret_password;
const char* mqtt_server = secret_mqtt_passwd;
const char* mqtt_username = secret_mqtt_username;
const char* mqtt_passwd = secret_mqtt_passwd;
const char* sensor_Name = "11.11.403 Temp/Hum";
void reconnect() {
  // Loop until we're reconnected
  while (!client.connected()) {
    Serial.print("Attempting MQTT connection...");
    // Create a random client ID
    String clientId = "ESP8266Client-";
    clientId += String(random(0xffff), HEX);
    // Attempt to connect
    if (client.connect(clientId.c_str(), mqtt_username,mqtt_passwd)) {
      Serial.println("connected");
      // Once connected, publish an announcement...
      client.publish("outTopic", "hello world");
      // ... and resubscribe
      client.subscribe("inTopic");
    } else {
      Serial.print("failed, rc=");
      Serial.print(client.state());
      Serial.println(" try again in 5 seconds");
      // Wait 5 seconds before retrying
      delay(5000);
    }
  }
}
Node red is a browser based flow editor for wiring flows together. The flows are then deployed in a single click. JavaScript functions can then be written for functionality between the flows and nodes within.
A function will return a payload as an output to a node such as a database, in our case InfluxDB.
Initially when we installed NodeRed our flow had two MQTT in nodes, one for humidity data and one for Temperature. We tried to join the nodes into one single message payload for the InfluxDB node. The problem we face is how do we get the joined data into different columns in the database by one message payload?
We decided it was best to have a single inject node placing dummy data into the formatting function to create the payload to send to the database with success.
We soon discovered we had our data management the wrong way around in the way we packaged from the sensor acquisition data to InfluxDB.
We wanted to name our sensor so if we had several sensor acquisition devices in different rooms we should identify and pull singular room data if needed. Along with the sensor name we wanted to send the corresponding humidity and temperature data.
For this we had to program the acquisition device to include the three aforementioned types. This meant in NodeRED we needed
This meant in NodeRED we needed to split the incoming packet from Mosquitto into the data types we want to store. To do this we split the data by the new line characters (‘/n’) highlighted in ‘Sample Code 1.1’. This produced the array seen in Sample Code 1.2 with the three types ‘packaged’ into an array sent as a single message payload to InfluxDB.
As we were able to split our message packet into an array for our message payload InfluxDB was able to put our data into the correct columns. By use of database queries in Grafana we can successfully visualise our data appropriately.
if ( (h - hlast) != 0 || (t - tlast) != 0 ) {
    hlast = h; tlast = t;
    snprintf (msg, 50, "%s\n%.1f\n%.1f",sensor_Name, h,t );
    Serial.println(msg);
    client.publish("sensor", msg);
}
Sample Code 1.1
var partsDHT = msg.payload.split("\n");

msg.payload = {
    Sensor_Name: partsDHT[0],
    Humidity: partsDHT[1],
    temp: partsDHT[2]
}
return msg;